The charts Google Slides was missing.
Waterfall charts, mekko charts, stacked bars, and more - built natively into Google Slides, synced with Google Sheets. The charting power you're used to, now in Google Slides.
No credit card required · Chrome & Edge

4.9 on G2
4.8 on Google
Try it yourself
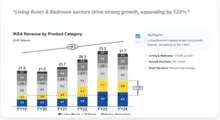
"Living Room & Bedroom sectors drive strong growth, expanding by 133%"
Highlights
Living/Bedroom categories are core growth engines, sustaining an 8% CAGR.
- Living & Bedroom: +133% growth.
- Overall Portfolio: 8% CAGR.
- Food Services: Recovering strongly.
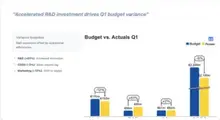
"Accelerated R&D drives Q1 budget variance"
Variance Snapshot
R&D expansion offset by operational efficiencies.
- R&D (+61%): Increased innovation.
- COGS (-5%): Sales volume lag.
- Marketing (-12%): Shift to digital.
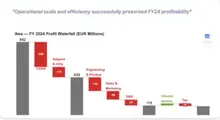
"Operational scale and efficiency successfully preserved FY24 profitability"


Trusted by leading brands


Loved by ex-consultants
"Chartbuddy offers exactly the right level of detail"
Mats Dirkzwager
Ex-Monitor Deloitte, Consultant
"Chartbuddy helps me prepare polished and professional slides. It has much of the functionality of the software I used as a consultant."
Courtenay S.
Ex-EY-Parthenon, Consultant
"Chartbuddy brings the refinement of PowerPoint to Google Slides without the hassle."
Vincent Oomes
Ex-Monitor Deloitte, Partner
"Love the time Chartbuddy saves me on personal projects where I want to bring my work-level quality. Quick, efficient, intuitive!"
Wouter Nientker
BCG, Manager
"Awesome product, have been using think-cell before but there was no alternative in the Google suite. Keep up the great work!"
Oliver van den Bergh
Ex-BCG, Consultant
"Chartbuddy helps us create insights, very rapidly."
Dennis Kant
Electric Transits Africa, CFO
Edit natively
No external editors, no switching tabs. Click a chart, edit the data, see it update instantly - all within Google Slides.
Customize everything
Smart arrows, number formatting, brand colors, date formatting, custom themes - match your company's identity down to every detail.
Google Sheets sync
Connect charts to your spreadsheet data. Update the source, refresh the chart. Built for automated reporting and recurring decks.
Every chart type
Bar graphs, line graphs, waterfall charts, mekko charts, and more - built for board decks and reporting.
Frequently asked questions
Learn more about Chartbuddy and how it helps you create professional charts in Google Slides.
Can't find what you're looking for? Visit our Help Center or contact us.
Your security is our priority
SOC 2 Type II Certified
Security controls independently audited and verified over time. Enterprise customers may request our security overview under NDA.

You Control What We Access
- Focused file access - we only see the specific presentations you choose to work with.
- Easy revocation - revoke access at any time through your Google account settings.

Secure by Design
- Encrypted in transit - HTTPS/TLS for all communication.
- OAuth 2.0 - your Google password is never shared with or stored by Chartbuddy.